
Getting Started with CDviz
This guide walks you through running CDviz locally using a demo Docker Compose stack with simulated events. In under 5 minutes you'll have a working environment: the CDviz Collector ingesting events, PostgreSQL storing them, and Grafana displaying DORA metrics — a safe sandbox to understand the platform before connecting real pipelines.
If you're new to CDviz, we recommend reading the CDviz Platform Overview to understand its core concepts and components.
1. Local Environment Setup
First, you'll need to get the CDviz demo environment up and running on your local machine.
Clone the CDviz repository:
bashgit clone https://github.com/cdviz-dev/cdviz.gitNavigate to the
stack-composedirectory:bashcd cdviz/demos/stack-composeLaunch the Docker Compose stack:
bashdocker compose upThis command will start all the necessary components: a web application for sending events, the CDviz Collector, the CDviz Database, and a pre-configured Grafana instance.
Access the demo dashboard in your browser: http://localhost:3000/d/demo_service_deployed/service3a-demo
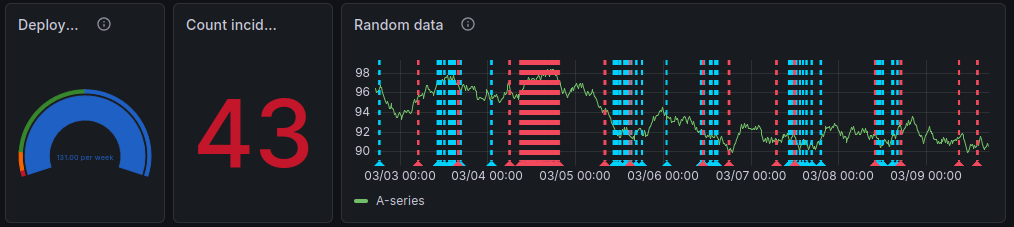
You should see a dashboard with some initial sample data.
Filter by service
my_app(not listed, as it didn't exist yet) to see the Empty Dashboard.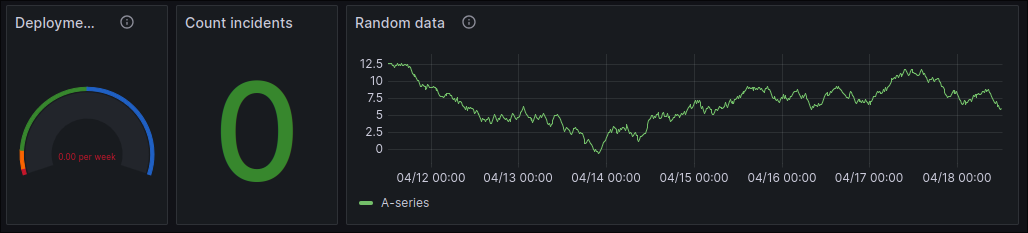
2. Sending Your First Events
Now that your local environment is running, let's manually send some events and watch them appear on the dashboard.
The demo provides forms that simulate events from your ticket system, CI tools, and artifact registries.
Service Deployment Events
On the dashboard page, scroll down to the "Services Deployed" form. This form allows you to simulate service deployment events.
Fill out the form with some sample data. For the artifact, you can use the Package URL (PURL) format. For example:
yamlservice: my_app action: deployed artifact: pkg:oci/my-app@sha256:1234567890abcdef?tag=0.1.0 environment: cluster/dev-01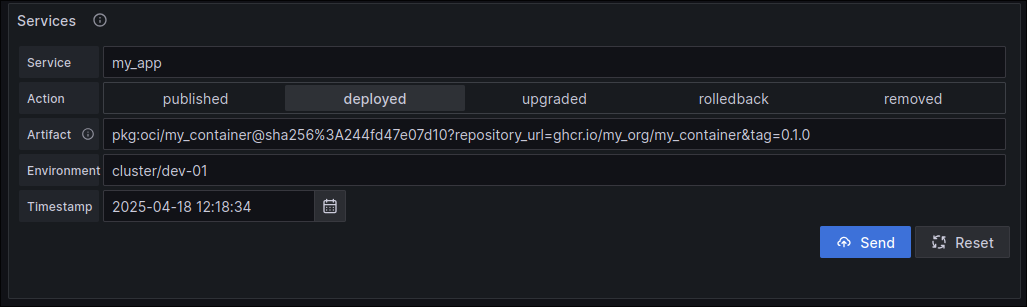
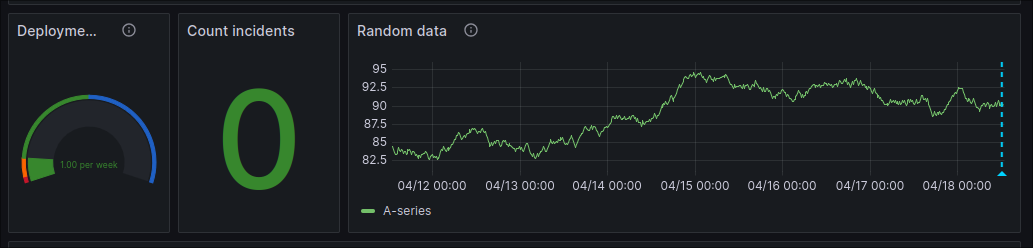
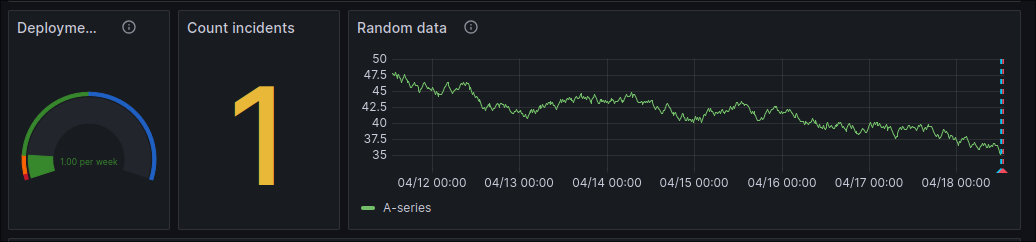
Click "Submit". You should see the "Deployment Frequency" and "Deployed Services" panels on the dashboard update to reflect the new event.
Incident Reporting
Scroll down to the "Incidents Reported" form. This form allows you to simulate incident events.
Fill out the form with some sample data.
yamlincident: incident-01 action: reported description: It doesn't work... environment: cluster/dev-01 service: my_app artifact: pkg:oci/my-app@sha256:1234567890abcdef?tag=0.1.0 ticketURI: http://ticket-system.example.com/PRJ-01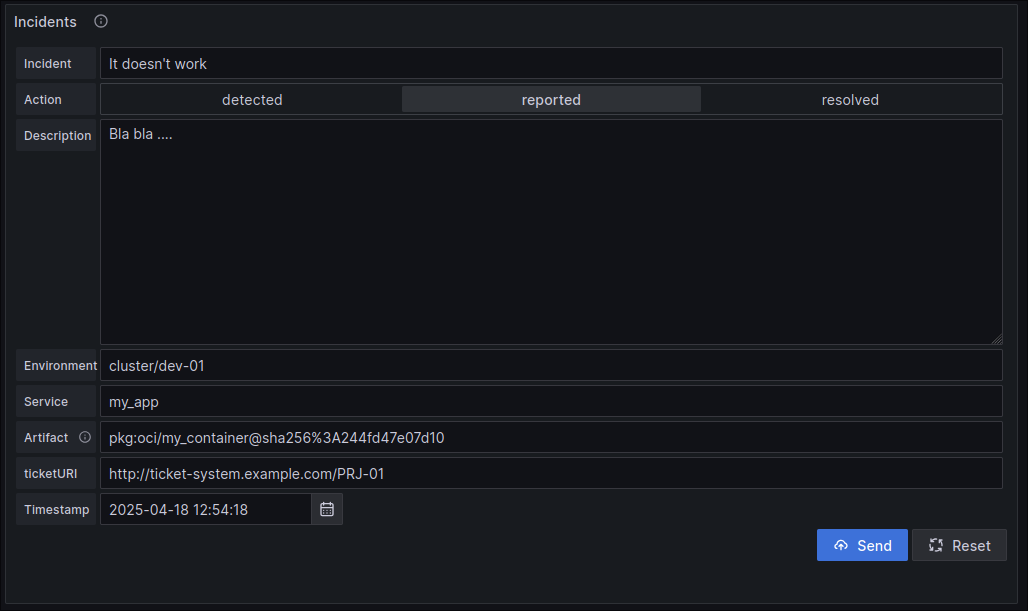
Click "Submit". You should see the "Incidents Reported" panel update to reflect the new incident.
3. Exploring Further
Congratulations! You've successfully sent your first CDEvents and visualized them in Grafana. Here are a few things you can do to continue exploring CDviz:
- Experiment with different events: Try sending different types of events with different data to see how they are reflected in the dashboards.
- Explore the CDEvents Activity dashboard: This dashboard provides a more detailed view of all the CDEvents that have been collected. You can access it at http://localhost:3000/d/cdevents-activity/cdevents-activity.
- Submit raw JSON events: For more advanced use cases, you can use the "Raw JSON" form to submit CDEvents in their raw JSON format.
- Explore other dashboards: and look at
cdviz/demos/uses_casesto see how data was injected (csv -> cdviz-collector (transformers) -> database)