
CDviz Grafana
CDviz Grafana provides pre-built dashboards that visualize CDEvents collected by the CDviz Collector. It surfaces DORA metrics, deployment timelines, artifact history, and incident tracking without any manual dashboard configuration.
Online Demo
Explore a live read-only instance of the CDviz Grafana dashboards at demo.cdviz.dev/grafana — no installation required.
NOTE
Dashboards, panels and SQL queries are provided for Grafana, but they can be adapted to your favorite dashboards & analytics system.
Overview
CDviz Grafana provides a comprehensive visualization layer for continuous delivery metrics and events:
- Delivers real-time visualization and monitoring of SDLC data through customized Grafana dashboards and alerts
- Functions as the primary visualization interface for events (CDEvents) stored in CDviz Database
- Enables creation of tailored dashboards for specific monitoring requirements
- Enhances runtime metrics with deployment context (such as component versions)
Installation
Requirements
- Grafana version: 12+
- Required Grafana Plugins:
- volkovlabs-echarts-panel (Business Charts)
- volkovlabs-form-panel (Business Forms)
- volkovlabs-table-panel (Business Table)
- cdviz-executiontable-panel (custom unsigned plugin — install from GitHub releases)
- Database credentials with read access to a CDviz Database instance
Manual Installation
- Install the required plugins and allow loading unsigned plugins (
cdviz-executiontable-panel) viaGF_PLUGINS_ALLOW_LOADING_UNSIGNED_PLUGINS=cdviz-executiontable-panel - Create a PostgreSQL datasource in Grafana to connect to the CDviz Database:
- Type:
postgres - Name:
cdviz-...(the cdviz prefix is used for datasource identification in dashboards) - TimescaleDB:
enabled
- Type:
- Import dashboards by copying JSON definitions from the CDviz GitHub repository
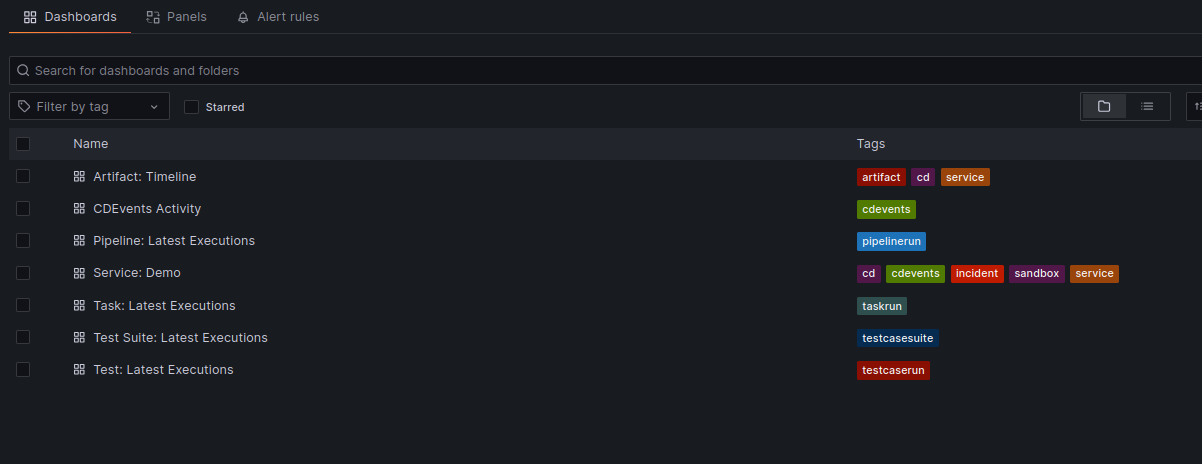
Available dashboards:
| Dashboard | Description |
|---|---|
| Artifact Timeline | Deployment and version tracking across environments |
| Execution Performance | Pipeline runs, task executions, and test results |
| DORA Metrics | Deployment frequency, lead time, time to restore, change failure rate |
| Incidents & Tickets | Open incidents, MTTR, and change cycle time |
| CDEvents Activity | Raw CDEvent stream and activity overview |
Kubernetes Deployment with Helm
Configure Grafana according to the requirements specified above
Enable dashboard and datasource provisioning via sidecars:
Grafana Helm Chart Configuration
yaml# https://grafana.com/docs/grafana/latest/setup-grafana/installation/helm/ # # Configuration override with environment variables # https://grafana.com/docs/grafana/latest/setup-grafana/configure-grafana/#override-configuration-with-environment-variables env: # Allow loading unsigned plugins (required for cdviz-executiontable-panel) GF_PLUGINS_ALLOW_LOADING_UNSIGNED_PLUGINS: "cdviz-executiontable-panel" # Pre-install plugins (Grafana 12+). Format: <id>[@<version>[@<url>]] GF_PLUGINS_PREINSTALL_SYNC: "volkovlabs-echarts-panel,volkovlabs-form-panel,volkovlabs-table-panel,cdviz-executiontable-panel@1.2.2@https://github.com/cdviz-dev/cdviz-executiontable-panel/releases/download/v1.2.2/cdviz-executiontable-panel-1.2.2.zip" # Sidecar configuration for dashboard and datasource provisioning sidecar: dashboards: enabled: true searchNamespace: ALL label: grafana_dashboard labelValue: "1" datasources: enabled: true searchNamespace: ALL label: grafana_datasource labelValue: "1"Configure the datasource either manually or by creating a values.yaml file for the CDviz Grafana chart:
yamldatasources: enabled: true definitions: cdviz-db: enabled: true type: grafana-postgresql-datasource access: proxy # Environment variable injection syntax url: "$CDVIZ_RO_POSTGRES_HOST:$CDVIZ_RO_POSTGRES_PORT_NUMBER" user: "$CDVIZ_RO_POSTGRES_USER" secureJsonData: password: "$CDVIZ_RO_POSTGRES_PASSWORD" jsonData: database: "$CDVIZ_RO_POSTGRES_DB" sslmode: "require" # Options: disable/require/verify-ca/verify-full maxOpenConns: 100 maxIdleConns: 100 maxIdleConnsAuto: true connMaxLifetime: 14400 postgresVersion: 1600 # 903=9.3, 1000=10, 1500=15, 1600=16 timescaledb: trueDeploy using the Helm chart:
bashhelm upgrade cdviz-grafana \ oci://ghcr.io/cdviz-dev/charts/cdviz-grafana \ --install \ --create-namespace \ --namespace cdviz
Contributing
Contributions to CDviz Grafana dashboards are welcomed. For new dashboard ideas, panel enhancements, or other improvements, please submit an issue or pull request to our GitHub repository.
Dashboard Design Guidelines
- Include a datasource selection variable (default prefix:
cdviz-) - Maintain consistent naming conventions with the
cdviz-prefix for datasource references - Set appropriate default time ranges (e.g.,
Last 7 daysorLast 30 days) - Utilize the Grafana Foundation SDK with TypeScript for dashboard generation (see dashboard generator code)
- Prioritize standard Grafana panels and officially supported plugins listed in the requirements section
License
All dashboards, panels, and SQL queries are licensed under the Apache Software License 2.0.