
DORA Metrics Dashboard
Online Demo
Explore a live read-only instance at demo.cdviz.dev/grafana — search for the DORA Metrics dashboard.
Overview
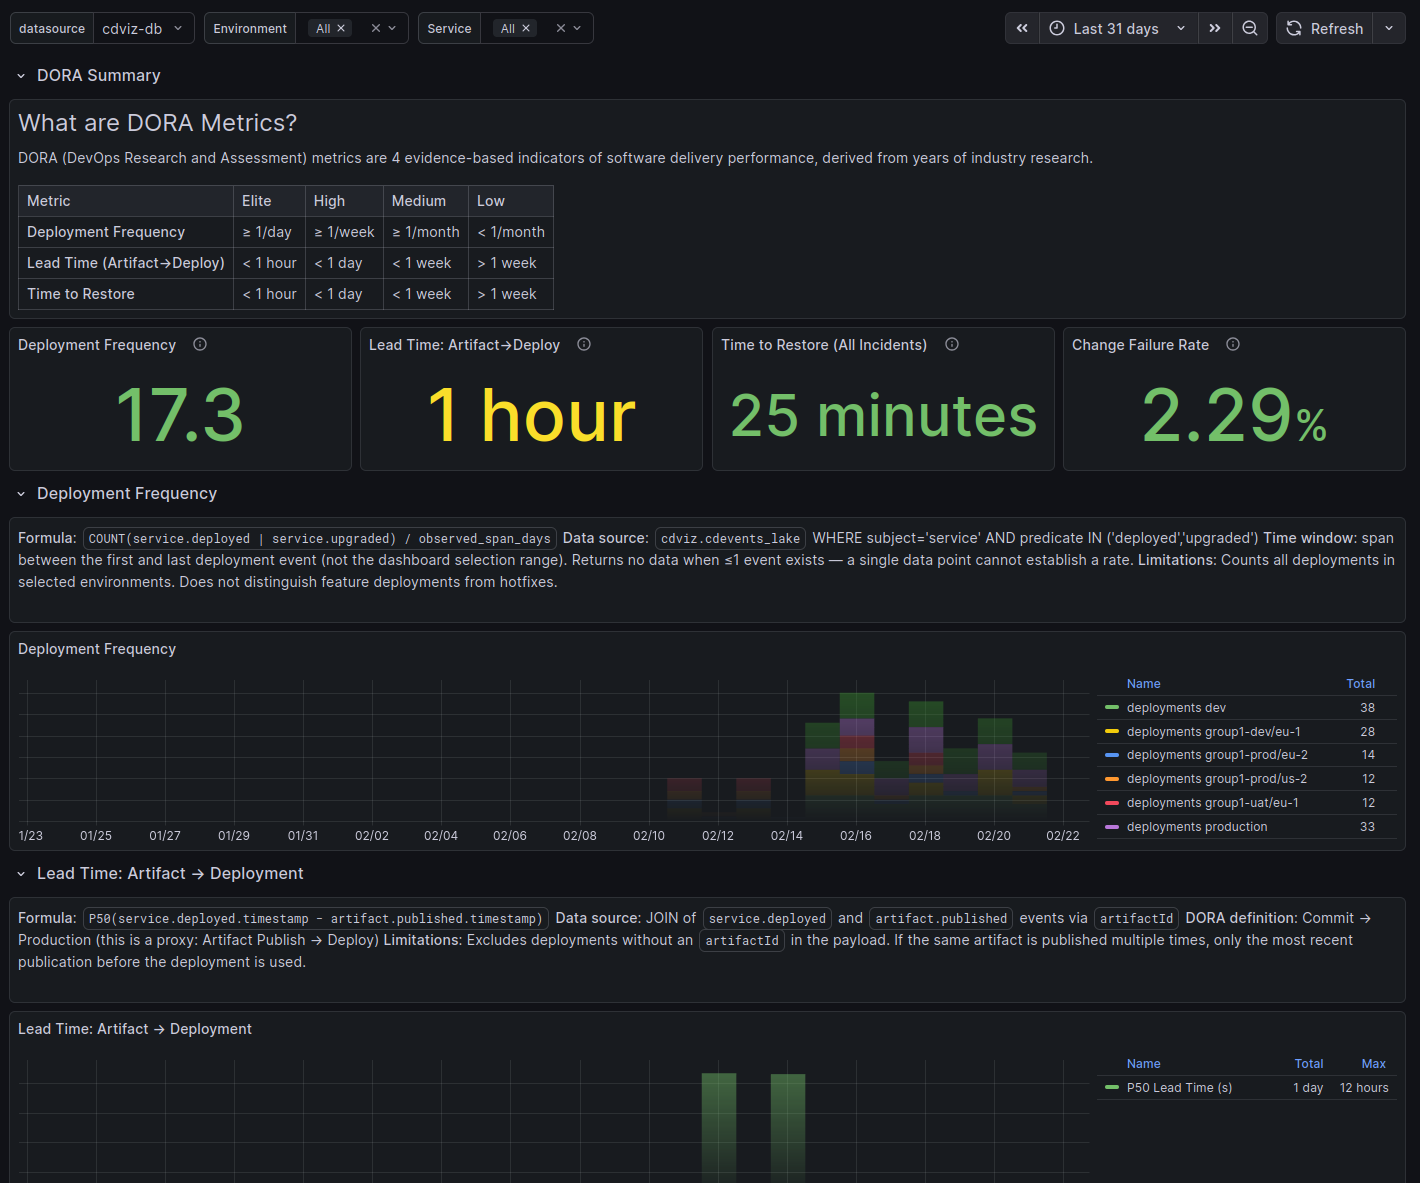
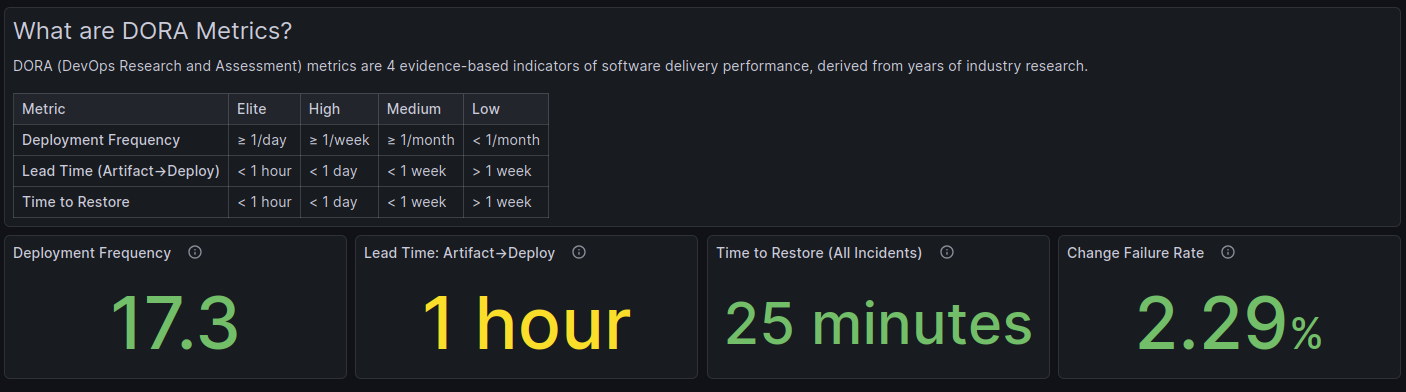
DORA (DevOps Research and Assessment) metrics are four evidence-based indicators of software delivery performance derived from years of industry research. This dashboard surfaces all four metrics from CDEvents emitted by your pipelines, deployments, and incident management systems.
These metrics are approximations
Precise DORA measurement requires correlating events across the full delivery chain: commit → CI pipeline → artifact → deployment → target environment. Each step typically involves a different tool (source control, CI, registry, orchestrator) and no tool natively knows its upstream or downstream neighbours.
CDviz derives values from whatever CDEvents are actually emitted. If a step does not emit events, or the causal link fields (e.g. artifactId) are absent, the corresponding metric falls back to a proxy or shows no data.
Precise DORA measurement is an open problem across the industry — the cross-tool tracing chain is genuinely difficult to close without a shared event standard. CDEvents is the community effort to make these links explicit. As your tools emit richer events, CDviz measurements improve automatically.
These formulas are a starting point. They will be refined as CDEvents adoption grows and edge cases are better understood.
| Metric | Elite | High | Medium | Low |
|---|---|---|---|---|
| Deployment Frequency | ≥ 1/day | ≥ 1/week | ≥ 1/month | < 1/month |
| Lead Time (Artifact→Deploy) | < 1 hour | < 1 day | < 1 week | > 1 week |
| Time to Restore | < 1 hour | < 1 day | < 1 week | > 1 week |
| Change Failure Rate | ≤ 5% | ≤ 10% | ≤ 15% | > 15% |
NOTE
All metrics are powered by CDEvents. If the required event types are not emitted, panels show no data — not zero values.
Dashboard Variables
environment— filter by deployment environment (populated fromservice.deployed/service.upgradedevents)service— filter by service ID, scoped to the selected environment
Metrics
Deployment Frequency
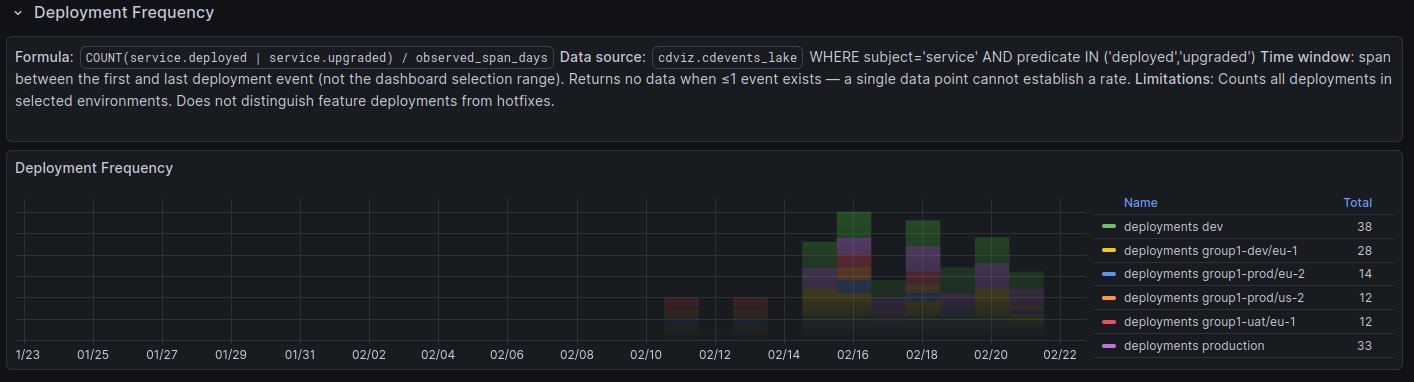
What it measures: How often code is deployed to production (or a target environment). Higher frequency indicates smaller, safer releases and faster feedback loops.
| Level | Threshold |
|---|---|
| Elite | ≥ 1 deployment/day |
| High | ≥ 1 deployment/week |
| Medium | ≥ 1 deployment/month |
| Low | < 1 deployment/month |
Required CDEvents: service.deployed, service.upgraded
Formula: COUNT(deployments) / observed_span_days
The denominator is the span between the first and last deployment event in the selected time window — not the full dashboard time range. This avoids artificially low rates when deployments are sparse at the edges of the window.
Known limitations:
- Returns no data when ≤ 1 event exists (a single data point cannot establish a rate)
- Does not distinguish feature deployments from hotfixes
- Counts all deployments in the selected environment regardless of outcome
Lead Time: Artifact → Deploy
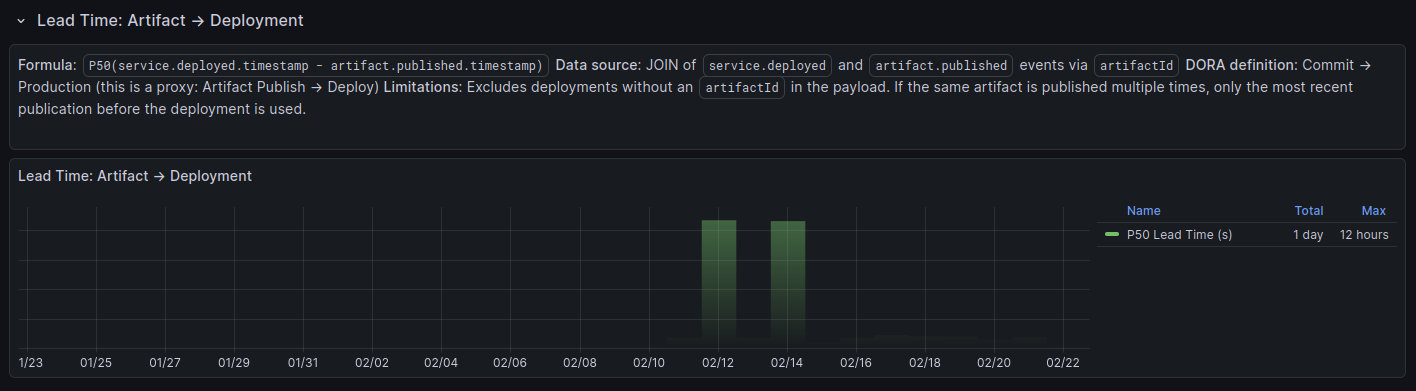
What it measures: Median time from when an artifact is published to when it is deployed to the target environment. This is a proxy for the DORA "Lead Time for Changes" metric (commit → production).
| Level | Threshold |
|---|---|
| Elite | < 1 hour |
| High | < 1 day |
| Medium | < 1 week |
| Low | > 1 week |
Required CDEvents: artifact.published, service.deployed or service.upgraded (with artifactId in payload)
Formula: P50(service.deployed.timestamp − artifact.published.timestamp)
The dashboard uses a LATERAL JOIN to match each deployment with the most recent artifact.published event that shares the same artifactId and occurred before the deployment.
Known limitations:
- Excludes deployments without an
artifactIdfield in the payload - If the same artifact is published multiple times, only the most recent publication before each deployment is used
- Does not capture the full commit-to-production lead time (the commit → artifact leg is covered by Pipeline Duration)
Lead Time: Pipeline Duration
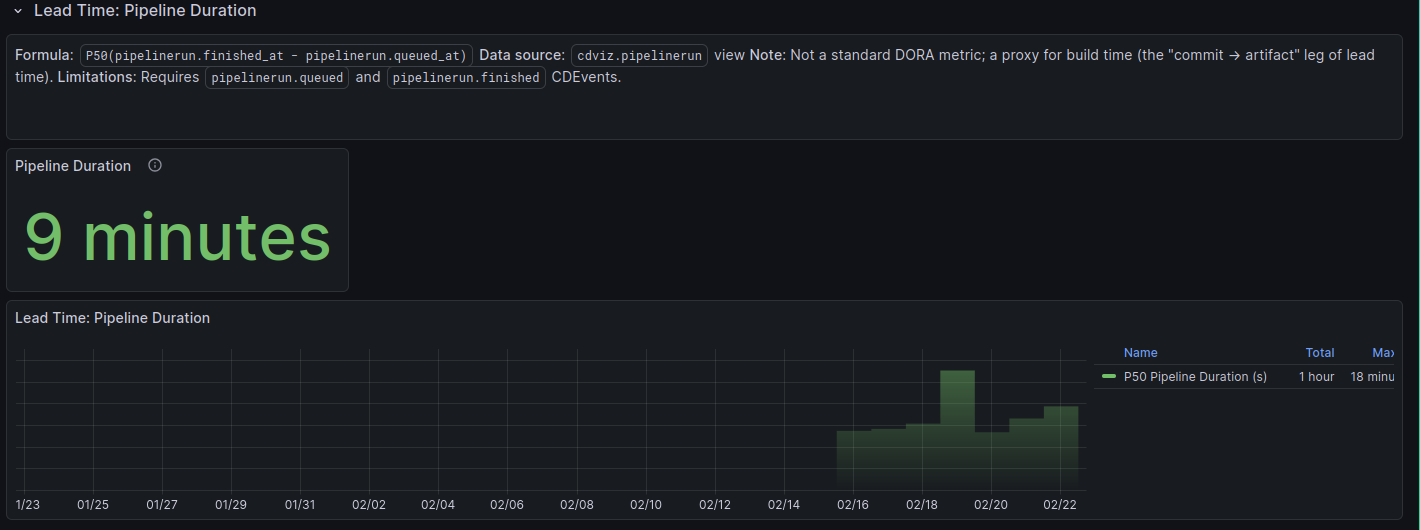
What it measures: Median pipeline run duration from queued to finished. This is not a standard DORA metric; it is a proxy for the build time component of lead time (the "commit → artifact" leg).
Required CDEvents: pipelinerun.queued, pipelinerun.finished
Formula: P50(pipelinerun.finished_at − pipelinerun.queued_at)
Known limitations:
- Requires both
pipelinerun.queuedandpipelinerun.finishedevents - Does not filter by environment or service — covers all pipelines in the selected time range
Time to Restore (All Incidents)
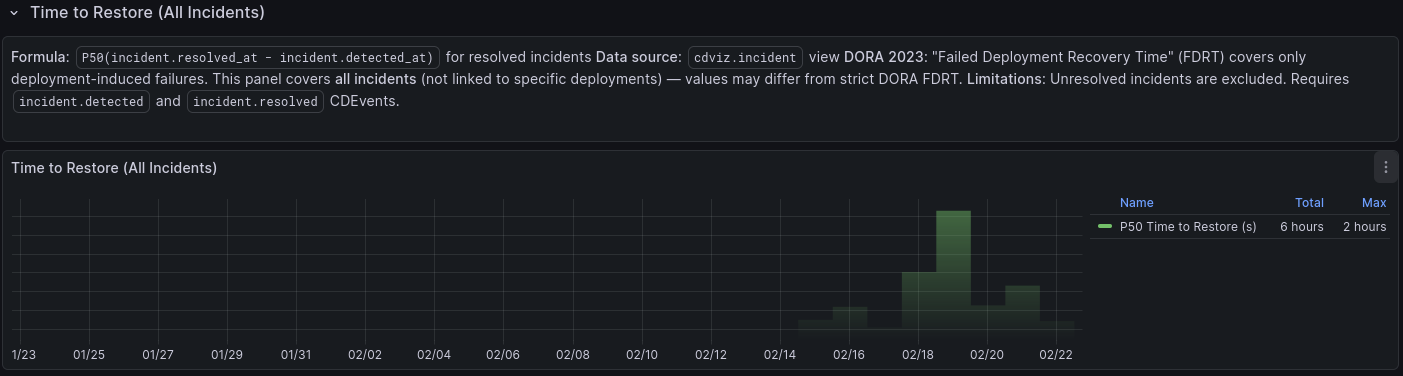
What it measures: Median time to resolve an incident once detected. Maps to the DORA "Time to Restore Service" metric (originally called MTTR, renamed in 2023).
| Level | Threshold |
|---|---|
| Elite | < 1 hour |
| High | < 1 day |
| Medium | < 1 week |
| Low | > 1 week |
Required CDEvents: incident.detected, incident.resolved
Formula: P50(incident.resolved_at − incident.detected_at) for resolved incidents
Known limitations:
- Covers all incidents, not only deployment-induced failures (see DORA 2023 note below)
- Unresolved incidents are excluded from the calculation
- Does not filter by environment or service
Change Failure Rate
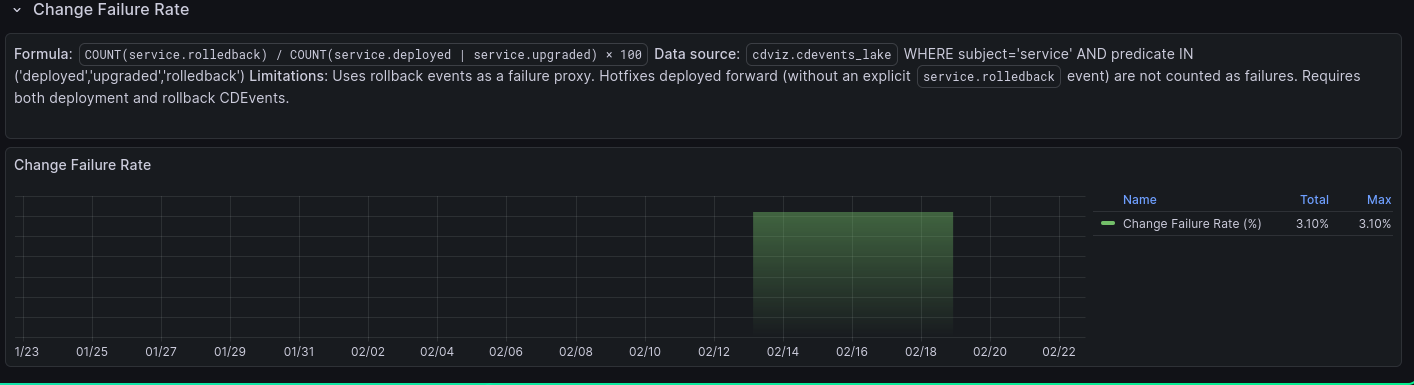
What it measures: The percentage of deployments that result in a rollback. A lower rate indicates higher deployment stability.
| Level | Threshold |
|---|---|
| Elite | ≤ 5% |
| High | ≤ 10% |
| Medium | ≤ 15% |
| Low | > 15% |
Required CDEvents: service.deployed, service.upgraded, service.rolledback
Formula: COUNT(service.rolledback) / COUNT(service.deployed | service.upgraded) × 100
Grouped weekly in the time series view to smooth out noise.
Known limitations:
- Uses explicit
service.rolledbackevents as the failure proxy - Hotfixes deployed forward (without a
service.rolledbackevent) are not counted as failures - Requires both deployment and rollback CDEvents for accurate measurement
Technical Considerations
CDEvents Requirements
| Event type | Used by |
|---|---|
service.deployed | Deployment Frequency, Lead Time, Change Failure Rate |
service.upgraded | Deployment Frequency, Lead Time, Change Failure Rate |
service.rolledback | Change Failure Rate |
artifact.published | Lead Time (Artifact→Deploy) |
incident.detected | Time to Restore |
incident.resolved | Time to Restore |
pipelinerun.queued | Lead Time (Pipeline Duration) |
pipelinerun.finished | Lead Time (Pipeline Duration) |
DORA 2023: MTTR → FDRT
In the 2023 DORA report, "Mean Time to Restore" (MTTR) was renamed to Failed Deployment Recovery Time (FDRT), scoping it to incidents caused by a specific deployment. This dashboard tracks all incidents as a proxy — values may differ from a strict FDRT calculation if your incident data includes non-deployment-caused outages.
Deployment Frequency Denominator
The stat panel computes rate over the first-to-last event span, not the dashboard time window. This returns no data when only a single deployment event exists in the selected range, since a rate cannot be derived from a single timestamp.
Lead Time LATERAL JOIN
The Lead Time calculation uses a LATERAL JOIN to find the most recent artifact.published event for each deployment. This ensures the correct publication is matched even when an artifact is published multiple times before being deployed.
Measurement Accuracy & Cross-Tool Tracing
True DORA metrics require an unbroken causal chain from code change to production:
| Step | Typical tool | CDEvents link field |
|---|---|---|
| Commit merged | GitHub / GitLab | — |
| CI pipeline triggered | GitHub Actions / Jenkins | pipelinerun.queued |
| Artifact published | Docker Registry / Artifactory | artifact.published (with digest/id) |
| Service deployed | ArgoCD / Flux / Helm | service.deployed (with artifactId) |
| Environment reached | Kubernetes / cloud | service.deployed environment field |
Each handoff is a potential gap. CDviz closes gaps that have CDEvents coverage; the rest are either approximated or missing. Specifically:
- Lead Time (Artifact→Deploy) skips the commit→artifact leg; the Pipeline Duration panel partially covers it but is not linked per-deployment.
- Change Failure Rate only counts explicit
service.rolledbackevents; forward-fixed failures (hotfixes without a rollback event) are invisible. - Time to Restore covers all incidents, not only deployment-induced ones.
Emitting richer CDEvents — particularly artifactId in service.deployed payloads and linking pipeline runs to their source commits — directly improves measurement accuracy without any dashboard changes.
Source Code References
- Dashboard generator: dora_metrics.ts
- Demo use cases: demos/use_cases/