
DORA Metrics. Deployment Timelines. Test Results.Open-Source. Self-Hosted. No Lock-In.Observe Your Software Delivery.Automate When You're Ready.
Sound familiar?
The visibility gap is costing you.
You deploy blind
You know a deploy happened. You don't know if it went to the right env, what version it replaced, or who approved it.
Incidents drag on
Without a shared timeline of changes, you're rebuilding context from Slack threads and git logs instead of restoring service.
DORA is a spreadsheet
Leadership wants DORA metrics. You're copying numbers from 5 dashboards into a Google Sheet every sprint.
CDviz automates the visibility layer so you can focus on delivery.
Your SDLC — Finally Visible
Production-ready Grafana dashboards. Customize for your workflow in minutes.
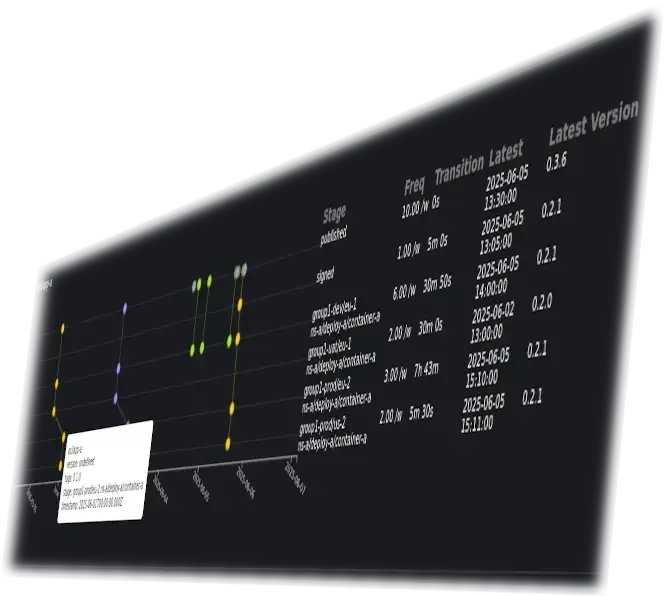
Artifact Timeline
Track which version landed in which environment — at a glance and historically. A starting point you can adapt to your own deployment workflow.
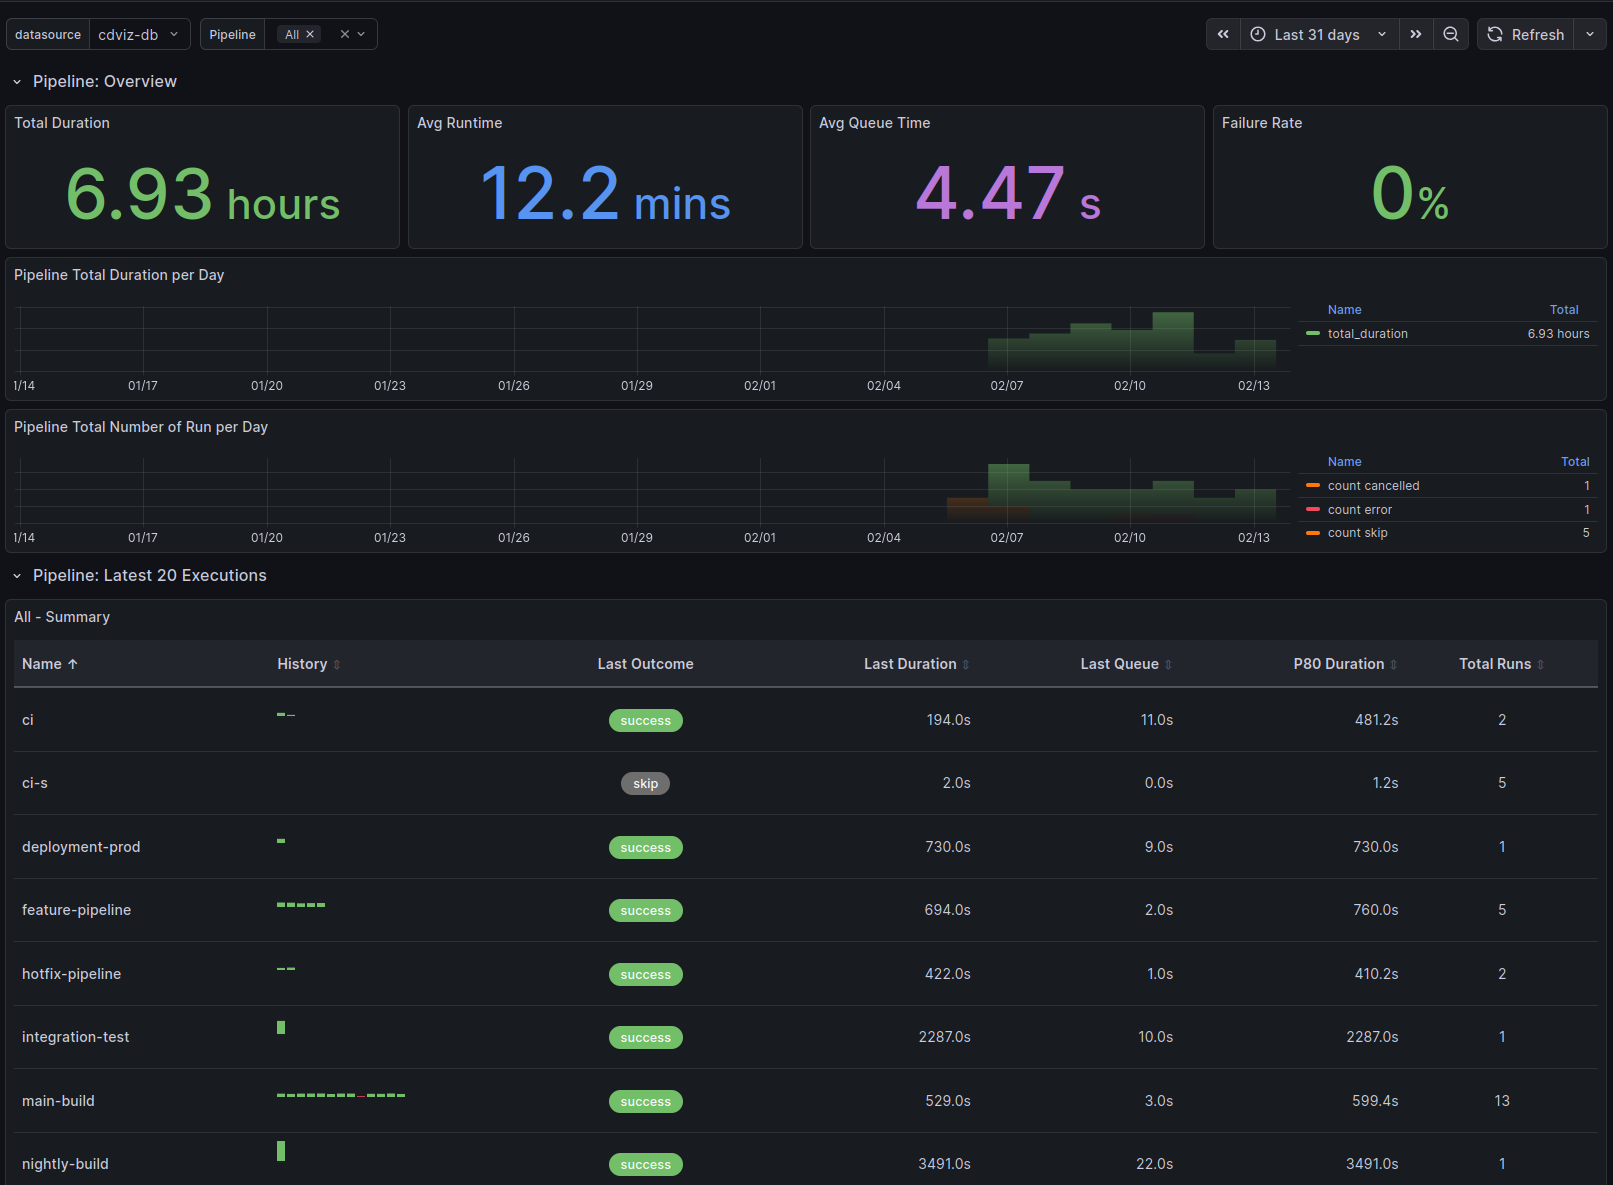
Execution Performance
Monitor pipeline runs, task executions, and test results — and spot trends over time. Customize the metrics and thresholds that matter to your team.
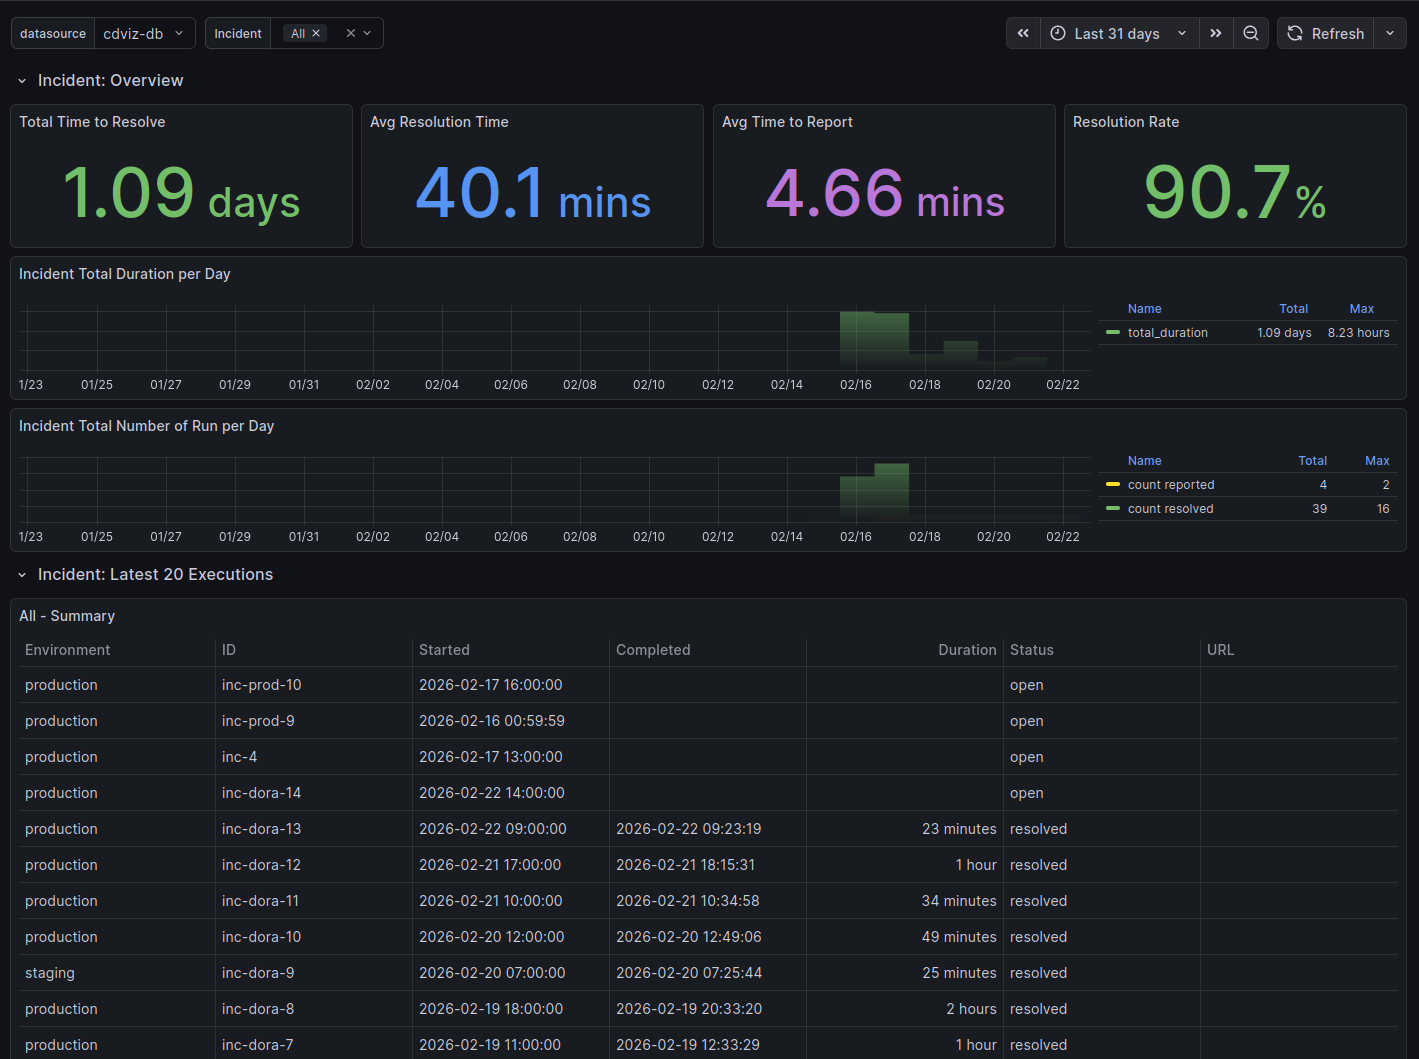
Incidents & Tickets
Track open incidents, time-to-restore, and change cycle times — fed from your incident management and ticketing tools via CDEvents.
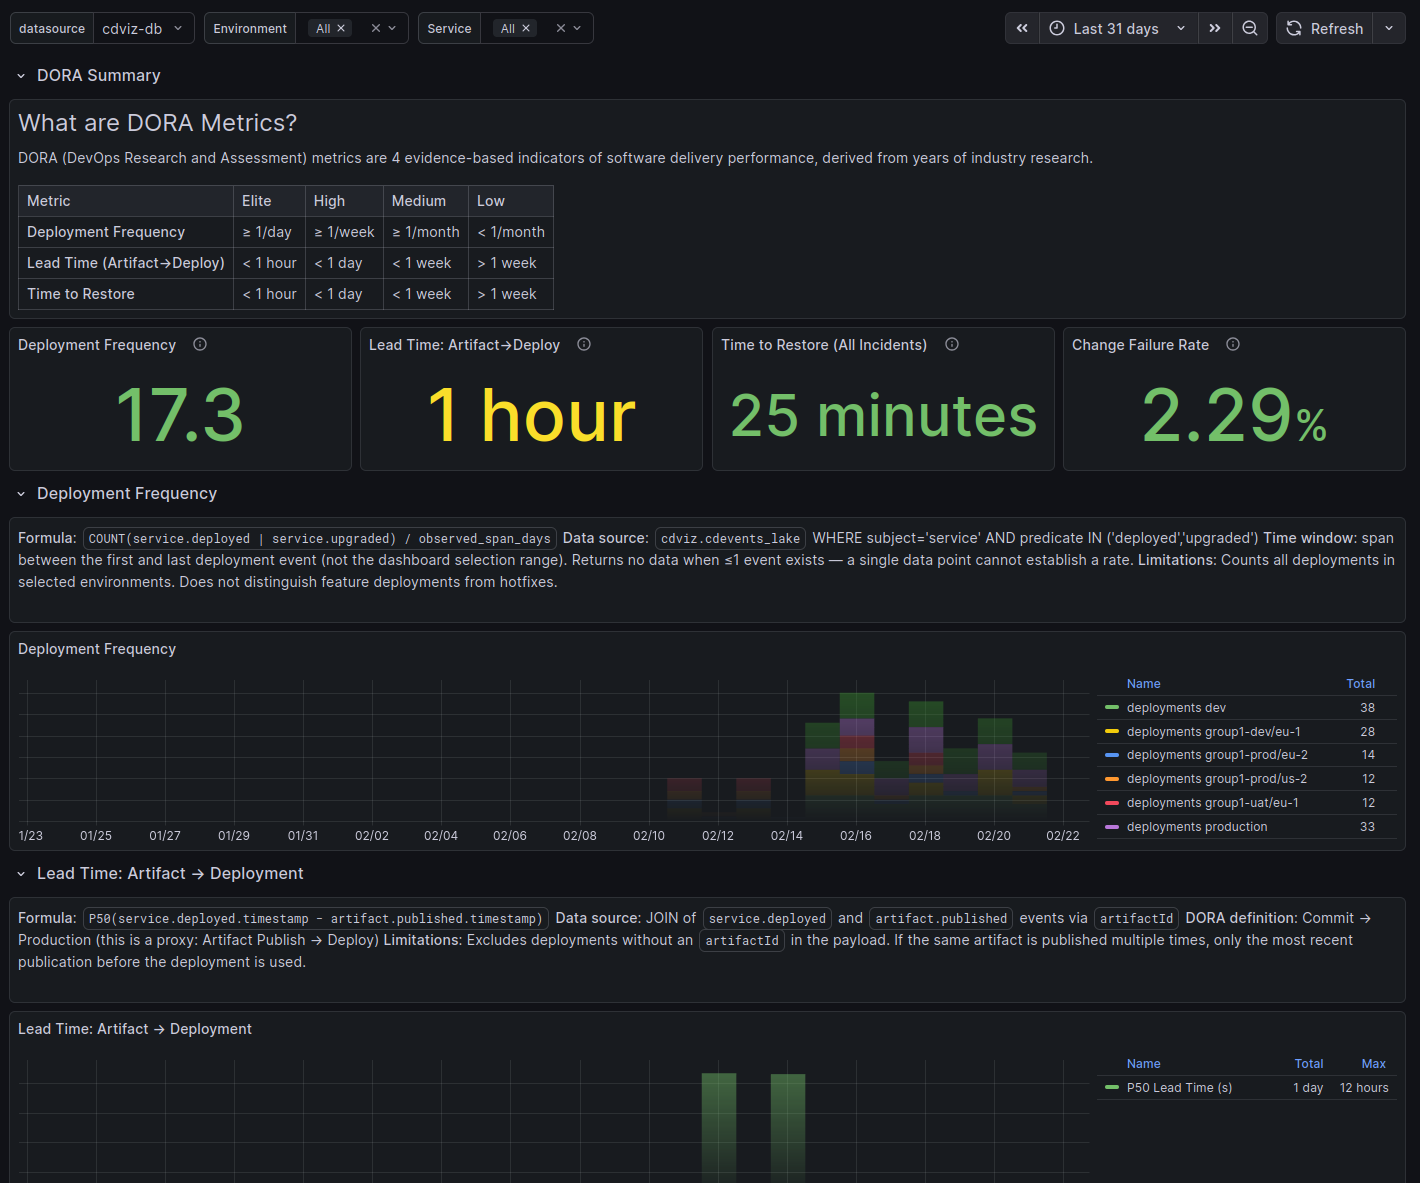
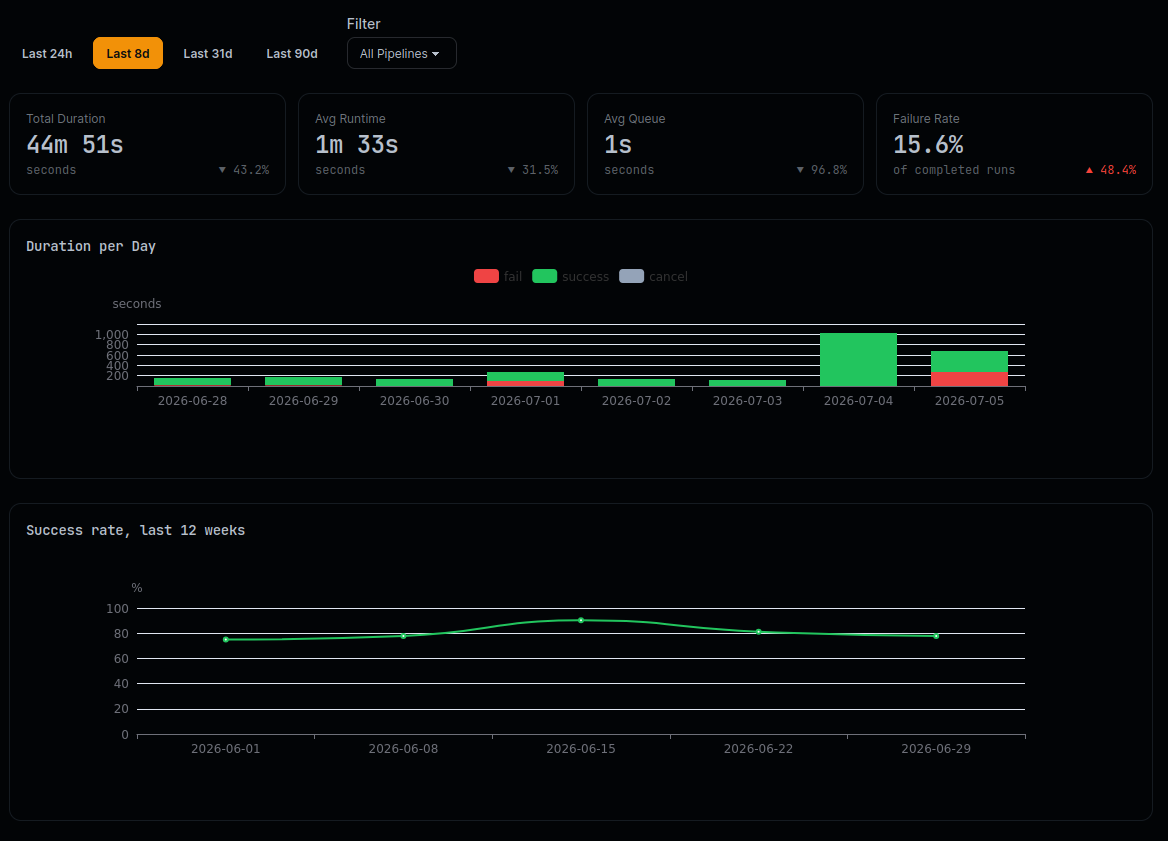
DORA Metrics
The four DORA indicators — deployment frequency, lead time, time to restore, and change failure rate — computed from your existing CDEvents. A baseline to benchmark and improve your delivery performance.
Missing a dashboard you need? Open a discussion →
Why Teams Choose CDviz
Know which version is deployed where, and when it arrived. Dashboards across your entire CI/CD pipeline — no more hunting across systems to understand your current state.
GitHub, GitLab, Jenkins, Kubernetes, Tekton, Harbor — plug in without changing a single workflow. Your team keeps shipping; CDviz starts watching.
Eliminate the "which version is in prod?" conversations. Shared dashboards mean shared accountability — and faster incident response.
From Events to Insight in 4 Steps
Collect events from GitHub, GitLab, Kubernetes, and 20+ sources. CDviz normalizes everything to the open CDEvents standard automatically.
Events land in PostgreSQL + TimescaleDB or ClickHouse. Indexed for speed. Retained for history. Query with plain SQL.
Pre-built Grafana dashboards surface DORA metrics, deployment timelines, and incident data. Extend and customize them to fit your team's workflow.
CDEvents can trigger n8n workflows, ArgoCD deployments, or custom webhooks. Observe and act — in the same pipeline.
Complete Architecture Overview
Click on a component to learn more
Frequently Asked Questions
Is it really free to use?▼
What's the difference between Cloud and Pro?▼
What is CDviz's commitment to open source?▼
How does it relate to CDEvents?▼
Ready to See Your Pipeline?
Self-host free — Pro features included during beta.
Open-source, no lock-in, actively developed.
Have a use case, questions, or ideas? → contact@cdviz.dev