
Execution Performance Dashboard
Overview
The Execution Performance Dashboard provides comprehensive visualization capabilities for monitoring duration and outcome statistics across various execution types in the continuous delivery pipeline. Each dashboard type includes:
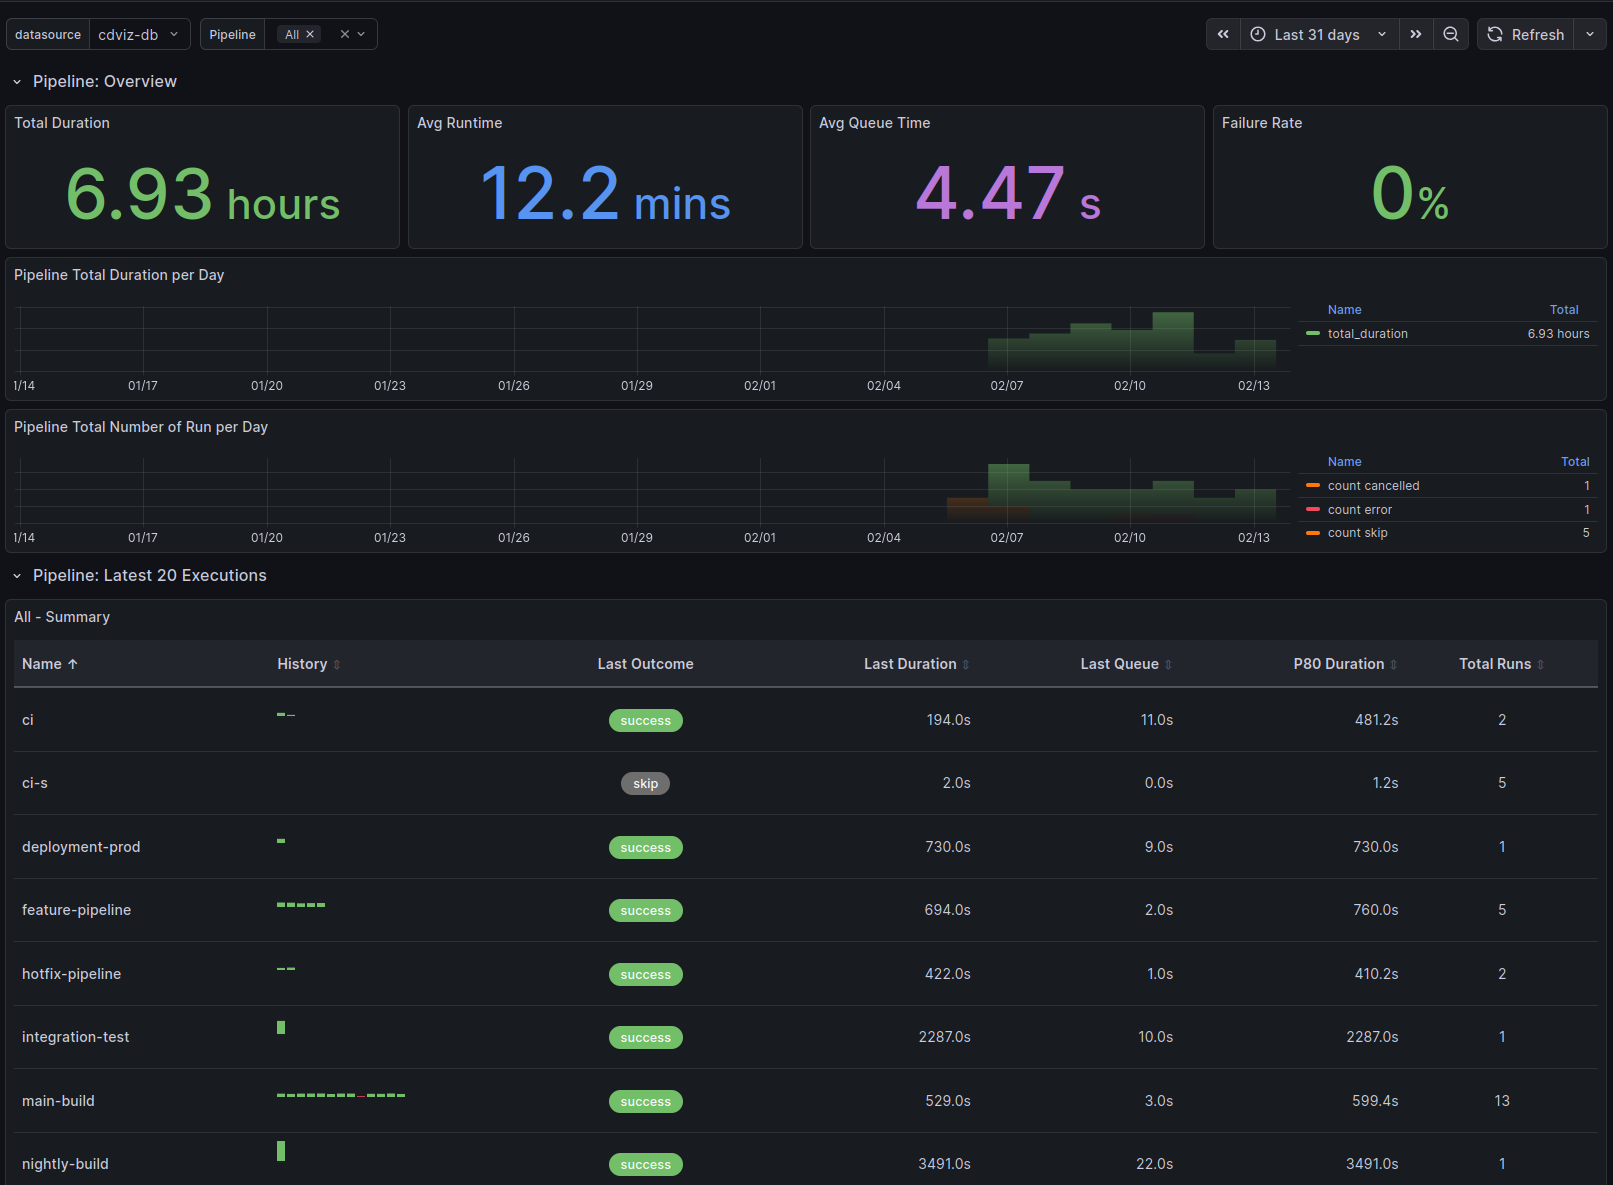
Overview Section - High-level metrics at a glance:
- Total Duration - Aggregate time spent across all executions
- Average Runtime - Mean execution time
- Average Queue Time - Mean time waiting to start (when applicable)
- Failure Rate - Percentage of failed executions (fail, failure, error) with color-coded thresholds
Time Series Visualizations:
- Total Duration per Day - Daily aggregated execution time
- Total Number of Run per Day - Execution counts by outcome (success, fail, error, skip, cancelled)
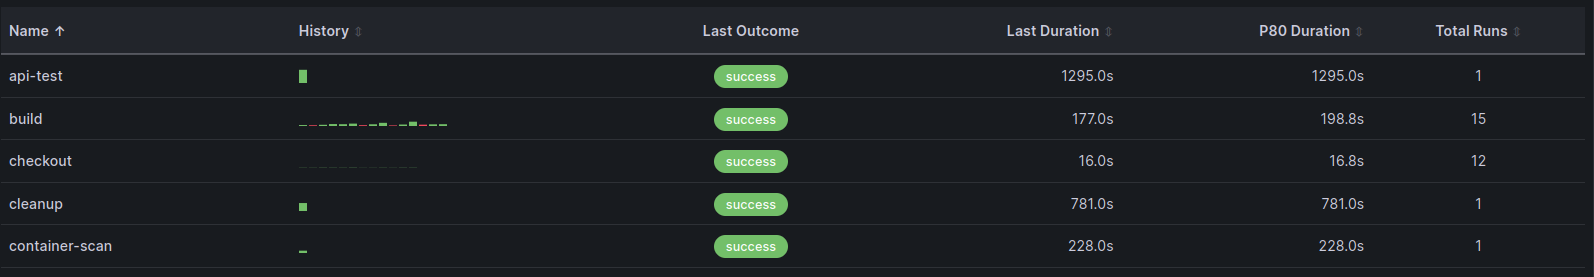
Execution Table - Detailed per-entity analysis showing:
- Name - Pipeline/task/test identifier
- History - Sparkline visualization of recent execution outcomes
- Last Outcome - Most recent execution status
- Last Duration - Most recent execution time
- Last Queue - Most recent queue time
- P80 Duration - 80th percentile execution time
- Total Runs - Count of executions in selected time range
- Passed - Count of executions with outcome pass/success
- Failed - Count of executions with outcome fail/failure/error
- Skipped - Count of executions with outcome skip/skipped
Dashboard Types
The execution dashboard generator creates dashboards for multiple execution types:
- Pipeline executions - CI/CD pipeline runs
- Task executions - Individual task runs
- Test case runs - Individual test executions
- Test suite runs - Test suite executions
Implementation Details
Overview Stat Panels
The overview section uses aggregation queries to calculate key metrics. Example query for average runtime:
SELECT
  COALESCE(AVG(extract('epoch' from (finished_at - started_at))), 0) AS avg_runtime
FROM cdviz.pipelinerun
WHERE
  ($__timeFilter(queued_at) OR $__timeFilter(finished_at))
  AND last_payload -> 'subject' -> 'content' ->> 'pipelineName' = ANY(ARRAY[${selected_value:sqlstring}]::text[])
  AND finished_at IS NOT NULL
Time Series Queries
Daily aggregations use TimescaleDB's time_bucket function for efficient grouping:
SELECT
  time_bucket('1 day', finished_at) AS time,
  SUM(extract('epoch' from (finished_at - started_at))) AS total_duration
FROM cdviz.pipelinerun
WHERE
  ($__timeFilter(queued_at) OR $__timeFilter(finished_at))
  AND last_payload -> 'subject' -> 'content' ->> 'pipelineName' = ANY(ARRAY[${selected_value:sqlstring}]::text[])
  AND finished_at IS NOT NULL
GROUP BY time
ORDER BY time
Execution Table Query
The table panel uses the custom cdviz-executiontable-panel plugin with a complex query that:
- Aggregates execution history per entity name
- Creates arrays of historical data for sparkline visualization
- Calculates P80 duration and total run counts
- Aggregates outcome counts (passed, failed, skipped) across all runs
- Includes last execution details (outcome, duration, queue time)
WITH
  execution_history AS (
    SELECT
      last_payload -> 'subject' -> 'content' ->> 'pipelineName' AS name,
      subject_id,
      outcome,
      extract('epoch' from (finished_at - started_at)) AS run_duration,
      extract('epoch' from (started_at - queued_at)) AS queue_duration,
      last_payload -> 'subject' -> 'content' ->> 'url' AS url,
      started_at,
      finished_at,
      queued_at,
      row_number() OVER (PARTITION BY last_payload -> 'subject' -> 'content' ->> 'pipelineName' ORDER BY finished_at DESC) AS rn
    FROM cdviz.pipelinerun
    WHERE
      ($__timeFilter(queued_at) OR $__timeFilter(finished_at))
      AND last_payload -> 'subject' -> 'content' ->> 'pipelineName' = ANY(ARRAY[${selected_value:sqlstring}]::text[])
      AND finished_at IS NOT NULL
  ),

  aggregated_stats AS (
    SELECT
      name,
      COALESCE(PERCENTILE_CONT(0.80) WITHIN GROUP (ORDER BY run_duration), 0) AS p80_duration,
      COUNT(*) AS total_runs
    FROM execution_history
    GROUP BY name
  ),

  history_arrays AS (
    SELECT
      name,
      COALESCE(array_agg(run_duration ORDER BY finished_at ASC) FILTER (WHERE rn <= 20), ARRAY[]::numeric[]) AS run_duration_history,
      COALESCE(array_agg(queue_duration ORDER BY finished_at ASC) FILTER (WHERE rn <= 20), ARRAY[]::numeric[]) AS queue_duration_history,
      COALESCE(array_agg(outcome ORDER BY finished_at ASC) FILTER (WHERE rn <= 20), ARRAY[]::text[]) AS outcome_history,
      COALESCE(array_agg(subject_id ORDER BY finished_at ASC) FILTER (WHERE rn <= 20), ARRAY[]::text[]) AS subject_id_history,
      COALESCE(array_agg(url ORDER BY finished_at ASC) FILTER (WHERE rn <= 20), ARRAY[]::text[]) AS url_history
    FROM execution_history
    WHERE rn <= 20
    GROUP BY name
  ),

  -- Aggregate outcome counts across all runs per name
  outcome_summary AS (
    SELECT
      name,
      COUNT(*) FILTER (WHERE outcome IN ('pass', 'success')) AS passed,
      COUNT(*) FILTER (WHERE outcome IN ('fail', 'failure', 'error')) AS failed,
      COUNT(*) FILTER (WHERE outcome IN ('skip', 'skipped')) AS skipped
    FROM execution_history
    GROUP BY name
  )

SELECT
  s.name AS "Name",
  h.run_duration_history AS "Run History (s)",
  h.outcome_history AS "Outcome History",
  h.subject_id_history AS "Run IDs",
  h.url_history AS "URLs",
  h.queue_duration_history AS "Queue History (s)",
  s.p80_duration AS "P80 Duration (s)",
  s.total_runs AS "Total Runs",
  COALESCE(o.passed, 0) AS "Passed",
  COALESCE(o.failed, 0) AS "Failed",
  COALESCE(o.skipped, 0) AS "Skipped"
FROM aggregated_stats s
LEFT JOIN history_arrays h ON s.name = h.name
LEFT JOIN outcome_summary o ON s.name = o.name
ORDER BY s.name
Technical Considerations
Database Views
- The SQL queries utilize materialized views defined on the
cdevents_laketable (e.g.,cdviz.pipelinerun,cdviz.taskrun) - Each view provides denormalized access to execution data with fields like
started_at,finished_at,queued_at,outcome - For missing views, consider:
- Submitting a pull request to add the view to the database schema
- Creating custom views in your environment
- Using SQL
WITHstatements in your queries as a workaround
Queue Duration
- Some execution types do not include queued duration metrics (e.g., task runs)
- Dashboards conditionally display "Avg Queue Time" stat panels and queue history columns based on execution type
- Pipeline runs, test case runs, and test suite runs track queue time; task runs do not
Custom Execution Table Panel
The dashboard uses the cdviz-executiontable-panel custom Grafana plugin for displaying execution history:
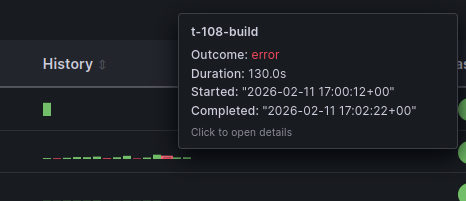
- History Visualization - Sparkline charts showing execution outcome trends
- Interactive Tooltips - Hover over sparklines for detailed execution information including timestamps, durations, and outcomes
- Configurable Display - Adjustable history items (default: 20), bar height, and gap settings
- Array Data Processing - Handles PostgreSQL array columns for efficient history storage
Dashboard Variables
selected_value- Multi-select variable for filtering by pipeline/task/test namelimit- Hidden variable controlling the number of executions displayed in the table (default:20)- Time Range - Standard Grafana time picker integration with
$__timeFilter()function
Coming Soon
Future enhancements to the execution dashboards include:
- Tag-based Filtering - Filter and group executions by:
- Environment (dev, staging, production)
- Artifacts (application versions, container images)
- Teams (ownership and responsibility)
- Custom metadata tags
Source Code References
- Database schema: migrations
- Dashboard generator: execution_dashboards.ts