
Incidents & Tickets Dashboard
Online Demo
Explore a live read-only instance at demo.cdviz.dev/grafana — search for the Incidents & Tickets dashboard.
Overview
The Incidents & Tickets dashboard surfaces operational health signals by tracking incidents and change events across your SDLC. It consolidates data from incident management tools (PagerDuty, Opsgenie, alerting pipelines) and ticketing or change-management systems (Jira, GitHub Issues, GitLab Issues) as long as they emit CDEvents.
Key questions answered:
- How many incidents are open right now, and how long have they been open?
- What is the median time to resolve incidents (MTTR / FDRT)?
- How many changes are in flight — created, in review, merged, abandoned?
- What is the cycle time from change creation to merge?
Dashboard Panels
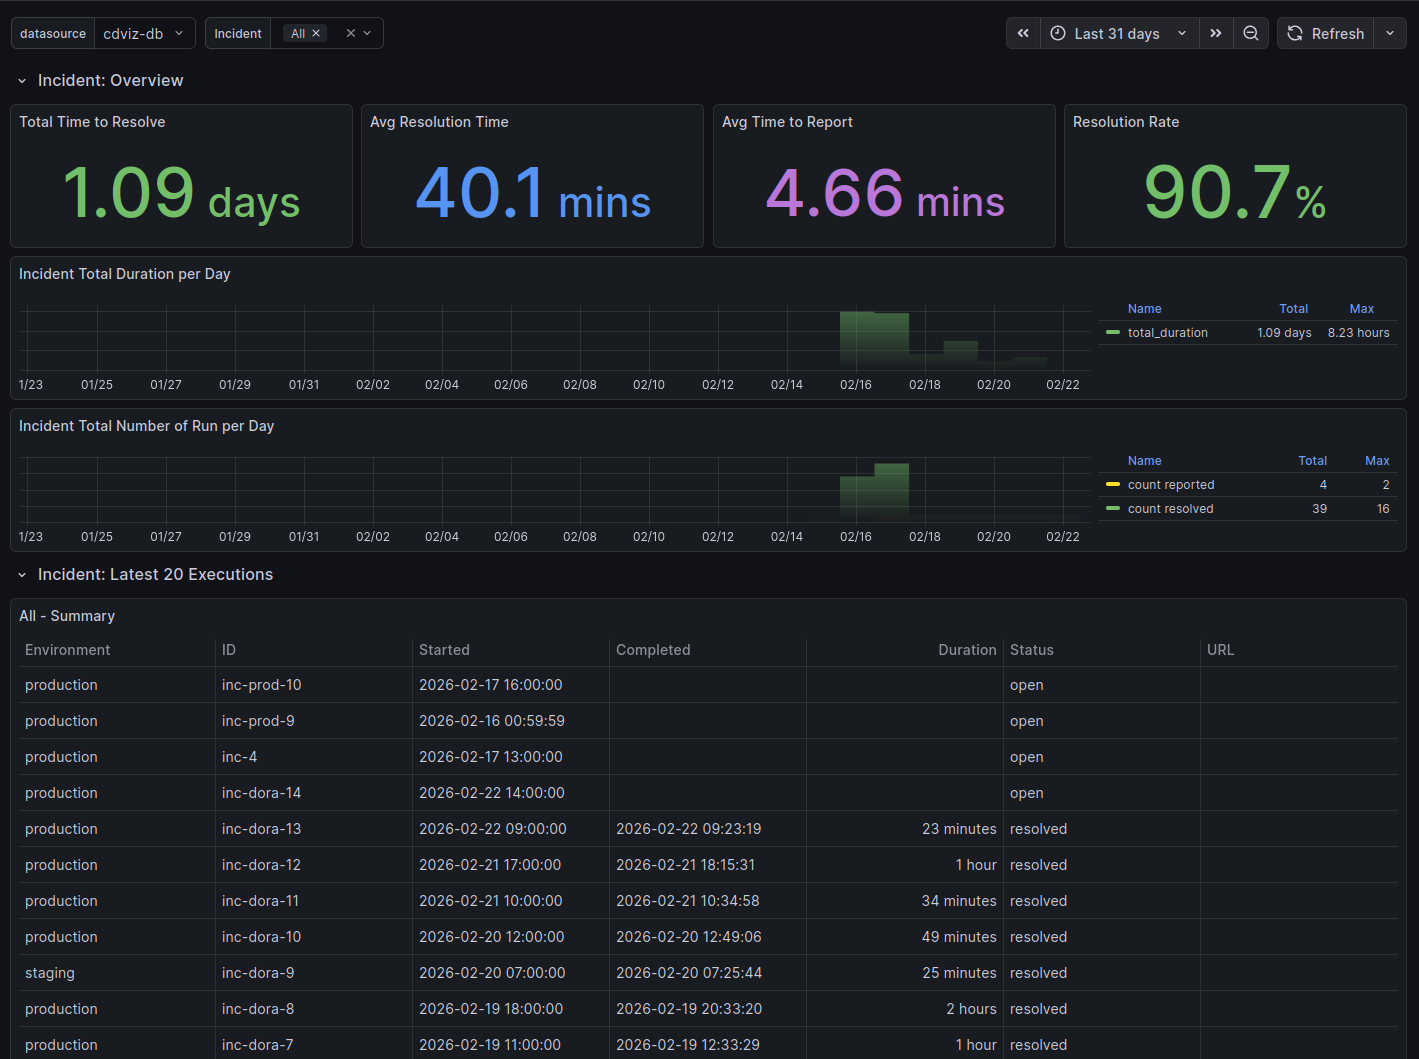
Incident Summary
An at-a-glance stat row showing:
| Stat | Description |
|---|---|
| Open Incidents | Count of detected but not yet resolved incidents in the selected time window |
| Resolved Incidents | Count of resolved incidents in the selected time window |
| Median TTR | Median time from incident.detected to incident.resolved |
| P95 TTR | 95th-percentile time to restore — surfaces outlier incidents |
Incidents Over Time
Time series of incident detections and resolutions grouped by day or week, making it easy to spot correlations with deployment waves or infrastructure changes.
Open Incidents Table
Scrollable table of currently open incidents with columns: incident ID, subject, source, detected timestamp, and age. Sorted by age (oldest first) to surface stale incidents.
Incident Severity Distribution
Bar chart grouping incidents by severity or type extracted from the CDEvent payload. Useful for understanding whether most incidents are low-noise alerts or high-severity outages.
Change/Ticket Summary
Stat row for change events:
| Stat | Description |
|---|---|
| Changes Created | change.created events in the selected window |
| Changes Merged | change.merged events |
| Changes Abandoned | change.abandoned events |
| Median Cycle Time | Median time from change.created to change.merged |
Change Cycle Time Histogram
Distribution of cycle times (creation → merge). Helps identify whether most changes are fast (hours) or slow (days/weeks).
Changes By State Table
Scrollable list of recent changes with their current state, subject, source, and timestamps.
Dashboard Variables
environment— filter incidents by environment (from the CDEvent subject or payload fields)source— filter by the tool or service that emitted the events (e.g.pagerduty,jira)
CDEvents Requirements
| Event type | Used by |
|---|---|
incident.detected | Open Incidents, Incidents Over Time, TTR |
incident.reported | Open Incidents, Incidents Over Time |
incident.resolved | Resolved Incidents, TTR, Incidents Over Time |
change.created | Change Summary, Cycle Time |
change.reviewed | Change activity |
change.merged | Change Summary, Cycle Time |
change.abandoned | Change Summary |
NOTE
Panels show no data — not zero — when the required event types have not been emitted. If your tools do not yet emit CDEvents natively, configure the CDviz Collector to translate webhook payloads using transformer rules.
Connecting Your Tools
PagerDuty / Opsgenie
Configure a webhook in your incident tool pointing to the CDviz Collector webhook source, then apply a transformer rule to map the tool-specific payload to incident.detected / incident.resolved CDEvents.
See the Transformer Rules documentation for mapping examples.
Jira / GitHub Issues / GitLab Issues
Use the corresponding CDviz Collector integration or a webhook transformer to emit change.created, change.merged, and change.abandoned CDEvents from issue state transitions.
Technical Notes
MTTR vs FDRT
The Median Time to Restore (MTTR) calculated here covers all incidents, not only those triggered by a specific deployment. The DORA 2023 specification introduced Failed Deployment Recovery Time (FDRT) as a deployment-scoped variant. For FDRT, use the DORA Metrics dashboard which correlates incident.resolved with the causal service.deployed event.
Cycle Time Calculation
Cycle time is computed as change.merged.timestamp − change.created.timestamp. Changes that are abandoned (never merged) are excluded from this calculation.
Source Code References
- Dashboard generator: incidents_tickets.ts
- CDEvents incident specification: cdevents-spec/schemas/