
Getting Started with CDviz
Welcome to CDviz! This guide will walk you through setting up a local CDviz environment to collect, store, and visualize your first CDEvents.
If you're new to CDviz, we recommend reading the CDviz Platform Overview to understand its core concepts and components.
1. Local Environment Setup
First, you'll need to get the CDviz demo environment up and running on your local machine.
Clone the CDviz repository:
bashgit clone https://github.com/cdviz-dev/cdviz.gitNavigate to the
stack-composedirectory:bashcd cdviz/demos/stack-composeLaunch the Docker Compose stack:
bashdocker compose upThis command will start all the necessary components: a web application for sending events, the CDviz Collector, the CDviz Database, and a pre-configured Grafana instance.
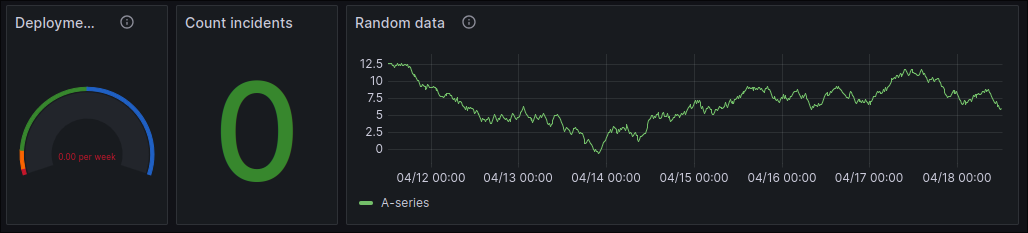
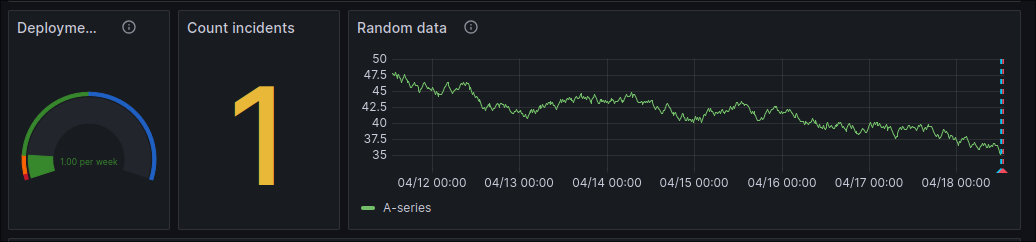
Access the demo dashboard in your browser: http://localhost:3000/d/demo-service-deployed/demo-service-deployed
You should see a dashboard with some initial sample data.
2. Sending Your First Events
Now that your local environment is running, let's send some events and see them appear on the dashboard.
Service Deployment Events
On the dashboard page, scroll down to the "Services Deployed" form. This form allows you to simulate service deployment events.
Fill out the form with some sample data. For the artifact, you can use the Package URL (PURL) format. For example:
pkg:oci/my-app@sha256:1234567890abcdef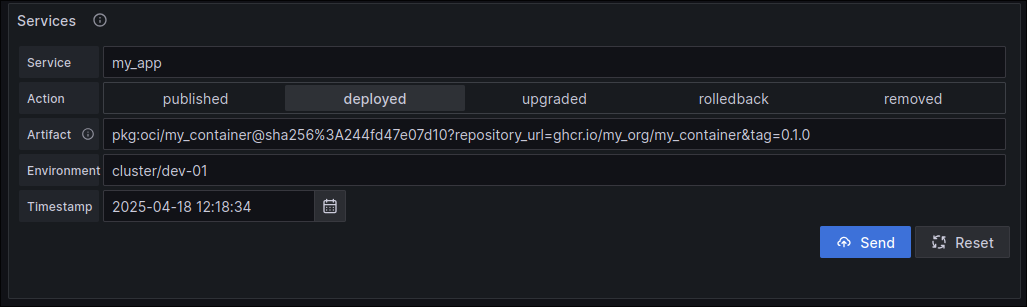
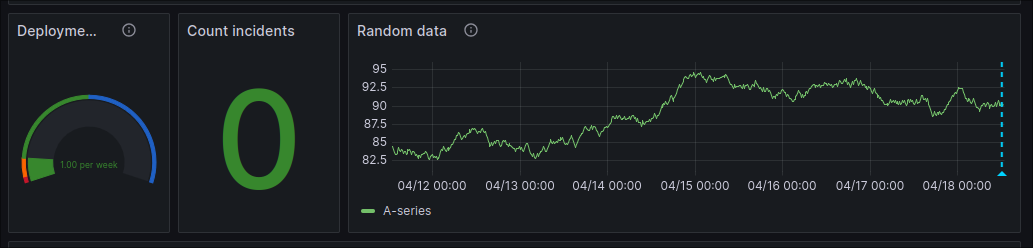
Click "Submit". You should see the "Deployment Frequency" and "Deployed Services" panels on the dashboard update to reflect the new event.
Incident Reporting
Scroll down to the "Incidents Reported" form. This form allows you to simulate incident events.
Fill out the form with some sample data.
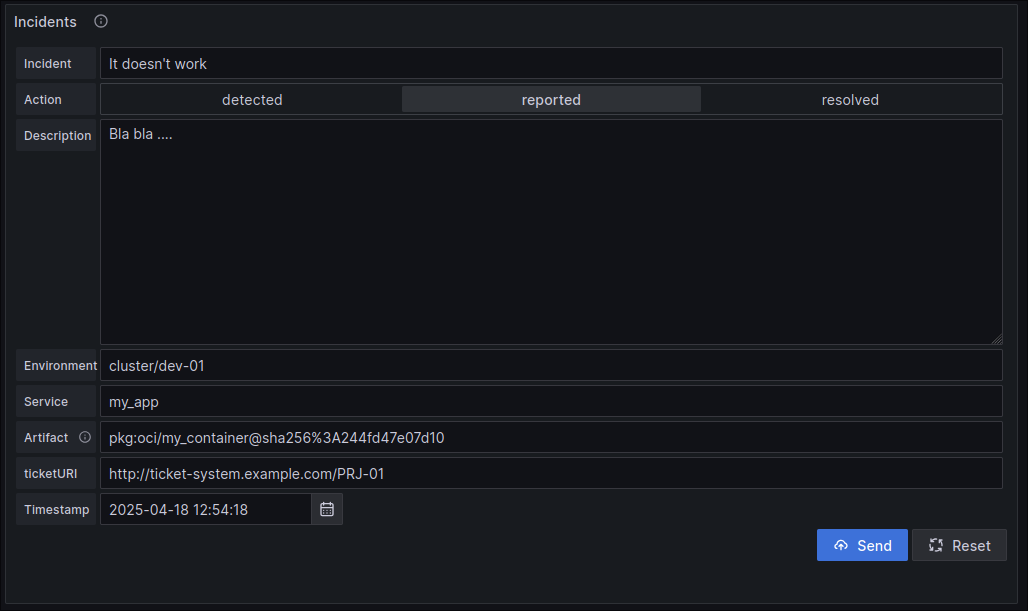
Click "Submit". You should see the "Incidents Reported" panel update to reflect the new incident.
3. Alternative: Using GitHub Actions
If you're using GitHub for your code repositories, you can send CDEvents directly from your GitHub workflows without setting up webhooks. The send-cdevents GitHub Action makes it easy to integrate CDviz into your CI/CD pipelines.
Quick Example
Add this to your .github/workflows/main.yml:
name: Notify CDviz
on:
  push:
    branches: [main]

jobs:
  notify:
    runs-on: ubuntu-latest
    steps:
      - name: Send deployment event
        uses: cdviz-dev/send-cdevents@v1
        with:
          data: |
            {
              "context": {
                "version": "0.4.1",
                "source": "github.com/${{ github.repository }}",
                "type": "dev.cdevents.service.deployed.0.1.4"
              },
              "subject": {
                "id": "myapp/production",
                "type": "service"
              }
            }
          url: "http://localhost:8080/webhook/github-actions"
For complete setup instructions, see the GitHub Action Integration Guide.
4. Exploring Further
Congratulations! You've successfully sent your first CDEvents and visualized them in Grafana. Here are a few things you can do to continue exploring CDviz:
- Experiment with different events: Try sending different types of events with different data to see how they are reflected in the dashboards.
- Explore the CDEvents Activity dashboard: This dashboard provides a more detailed view of all the CDEvents that have been collected. You can access it at http://localhost:3000/d/cdevents-activity/cdevents-activity.
- Submit raw JSON events: For more advanced use cases, you can use the "Raw JSON" form to submit CDEvents in their raw JSON format.
Next Steps
Now that you have a basic understanding of how to use CDviz, you're ready to start using it in your own environment. Here are some resources to help you get started:
- CDviz Collector Documentation: Learn how to configure the CDviz Collector to collect events from your own systems.
- CDviz Database Documentation: Learn how to set up and manage the CDviz Database.
- CDviz Grafana Documentation: Learn how to create your own custom dashboards and alerts in Grafana.