
CDEvents in Action #0: Monitor Your Software Factory
You have an impressive CI/CD stack: GitHub, Jenkins, Kubernetes, Datadog, PagerDuty. But when leadership asks "How fast do we deploy?" you're opening 6 browser tabs and building spreadsheets.
The Current Reality

Before CDviz: You manually correlate data from scattered tools
Each tool has its own data, but few tools communicate with each other. You become the integration layer.
What CDviz Actually Provides Today
Event Collection: Collects events (CDEvents, native HTTP events, or states) and produces standardized CDEvents from your existing tools Storage: PostgreSQL database with TimescaleDB extension for time-series CDEvent storage Visualization: Pre-built Grafana dashboards for deployment tracking and execution metrics

Current Dashboards

- Service and artifact deployment timeline across stages (registry, environments, etc.)
- CDEvents activity feed with real-time updates
- Duration metrics for tasks, pipelines, and tests
- Queries to annotate runtime metrics with version information
What's Not Included (Yet)
- DORA metrics calculations (you build the SQL queries)
- Automated incident correlation (data is available, custom queries required)
- Multi-team comparisons (possible but requires additional configuration)
5-Minute Demo: See the Difference
# Start CDviz locally
git clone https://github.com/cdviz-dev/cdviz.git
cd cdviz/demos/stack-compose
docker compose up

# Send a deployment event
curl -i -X POST http://localhost:8080/webhook/000-cdevents \
  -H "Content-Type: application/json" \
  -d '{
    "context": {
      "version": "0.4.1",
      "source": "demo",
      "type": "dev.cdevents.service.deployed.0.2.0",
      "timestamp": "'$(date -u +%Y-%m-%dT%H:%M:%SZ)'"
    },
    "subject": {
      "id": "my-namespace/my-service/my-container",
      "type": "service",
      "content": {
        "environment": {
          "id": "my-group/my-region"
        },
        "artifactId": "pkg:oci/my-service@v1.2.3"
      }
    }
  }'

# View dashboard
open localhost:3000/d/demo_service_deployed/service3a-demoResult: Event appears immediately in timeline. No manual correlation needed.
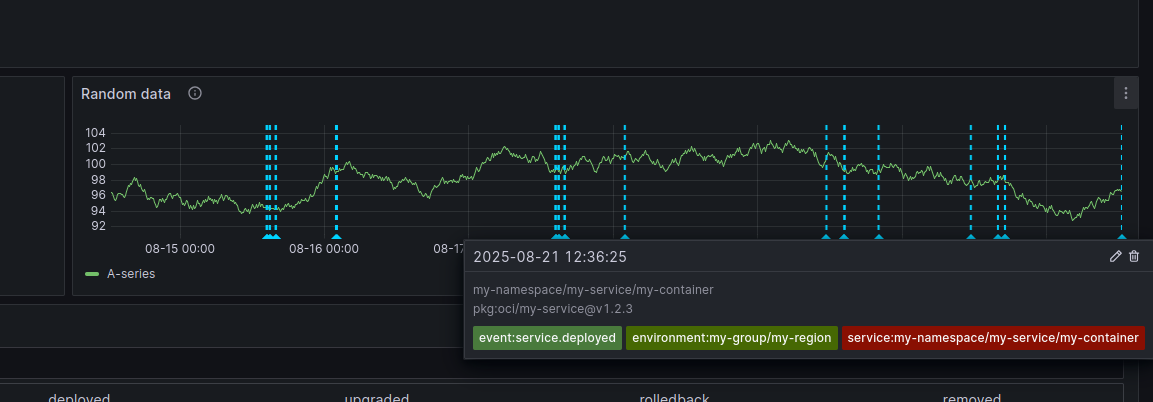
Some events are generated automatically by the demo. Browse the other dashboard to see some possibilities.
The Value: Time and Accuracy
Before CDviz:
- Query GitHub: 5 minutes
- Check Jenkins: 3 minutes
- Correlate timestamps: 10 minutes
- Build report: 15 minutes
- Total: 33 minutes per request
After CDviz integration:
- Open dashboard: 1 minute
- Total: 1 minute
Real Questions CDviz Helps Answer
✅ "What version is running in production right now?" ✅ "When did we last deploy service X?" ✅ "Show me all deployments from last week" ✅ "What's our deployment frequency?"
🔄 "How do teams compare?" (data available, dashboard TBD) ❌ "What's our lead time?" (needs commit events integration)
Next Steps
This is Episode 0 of our "CDEvents in Action" series. Coming up:
- Episode #1: "Simulate a Consumer" - Test your CDEvents integration before building with webhook.site, CDviz docker compose, and cdviz-collector
- Episode #2: "Send CDEvents for Custom Integration" - Producer patterns with curl+bash, cdviz-collector send, and send-cdevents GitHub Action
- Episode #3: "Webhook and Transformer Patterns" - Reduce manual instrumentation overhead
You can explore CDviz's documentation and try the 5-minute demo to get started with CDEvents-based pipeline visibility.